Work throughpublished composite cases. Each study starts with a real public engineering example, shows exactly what to build in CDS, defines review checkpoints, and distinguishes a learning comparison from a qualified design value.
Complete manuals · download a whole collection Each collection includes an editable Word manual and its matching searchable PDF, with linked contents, explanatory text, diagrams and references. Theory equations use native Word mathematics. Individual-page PDF buttons remain available.
Complete User Guide 148 pages · 10 chapters · Updated 2026-09-18 Getting Started Handbook 139 pages · 8 chapters · Updated 2026-09-18 Training & Exercise Manual 386 pages · 115 chapters · all 104 exercises · Updated 2026-09-18 Complete Theory Manual 255 pages · 56 chapters · Updated 2026-09-18 Models & Workflow Manual 85 pages · 9 chapters · Updated 2026-09-18 These are dated reading editions of the public learning content. Interactive studies and account-controlled classroom notes and databases stay online. For current changes, follow the chapter links back to the website.
CDS User Guide Controls and practical workflows ∑ CDS Theory Manual Equations, assumptions and model limits Learning curriculum CDS Training Manual · exercises and checkpoints Current Workbench, reference editions and downloads Use the online User Guide for current controls, the released model directory for selectable models and compatibility, and the Training Manual for connected exercises. Wider theory references do not mean every formulation is enabled in Workbench.
Dated GUI captures and compiled Web r18 PDF manuals retain their stated scope; they are not a substitute for current hosted Workbench instructions. Find the overview PDF, guides and exercise databases in Your CDS library .
Exercise curriculum Shared CDS database Search exercises ApplicationAll Angle-ply laminate design Constituent-to-lamina comparison Pressure-vessel damage-tolerance context Thick-panel cure and exotherm ModelAll 1D transient heat transfer CHILE Carpet plots Classical first-ply failure Classical laminate theory Cure kinetics Halpin–Tsai MAC/GMC comparison Process optimization Rule of mixtures Thin-wall membrane GeometryAll 305 mm circular cylinder 40-ply through-thickness slab Circular tube Unidirectional lamina Resource typeAll Web case study
Group / sort by Learning order · easy to hard Application Model Geometry Clear filters 4 of 4 resources
Exercises Expand all Collapse all
⌄ 1. Getting started 1 NASA · T700/PR520 lamina analysis Web ⌄ 2. Design & applications 1 NASA · Balanced T700/epoxy tube laminate Web ⌄ 3. Advanced & coupled studies 2 NASA · AS4/3501-6 pressure-cylinder screening Web NASA · Thick T700S/TC380 cure process Web Click to preview · double-click or Enter to open in Workbench.
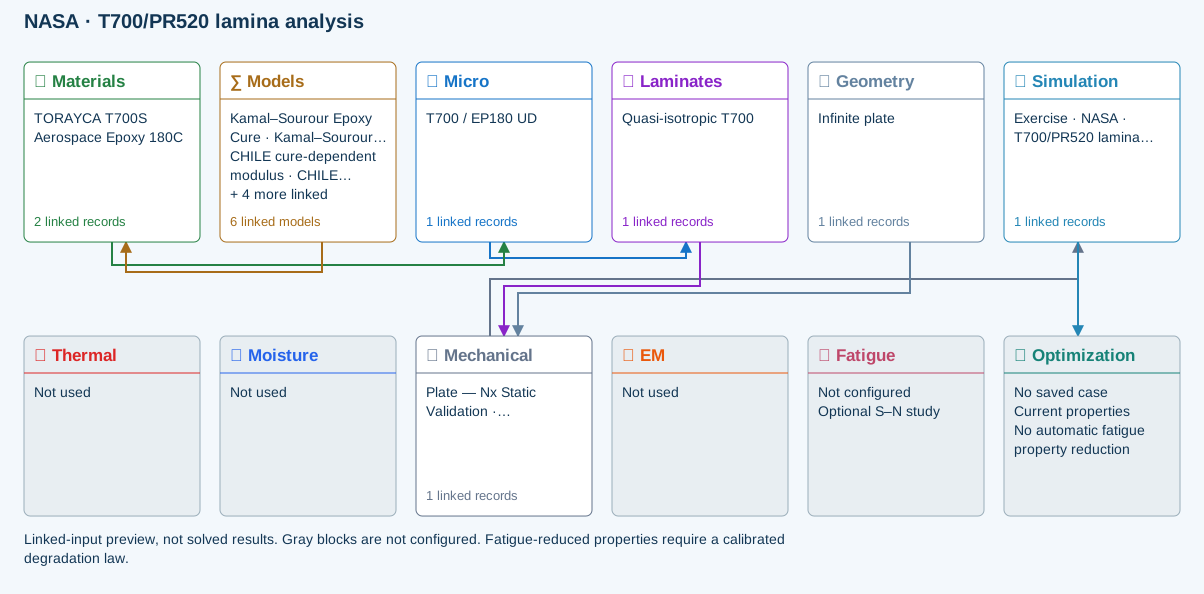
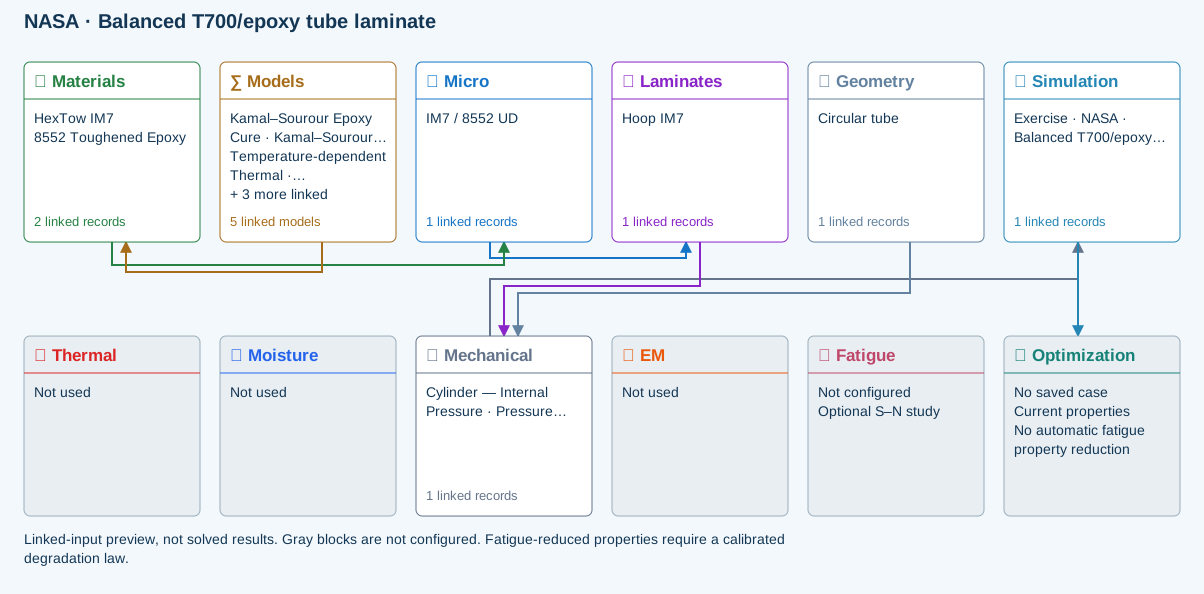
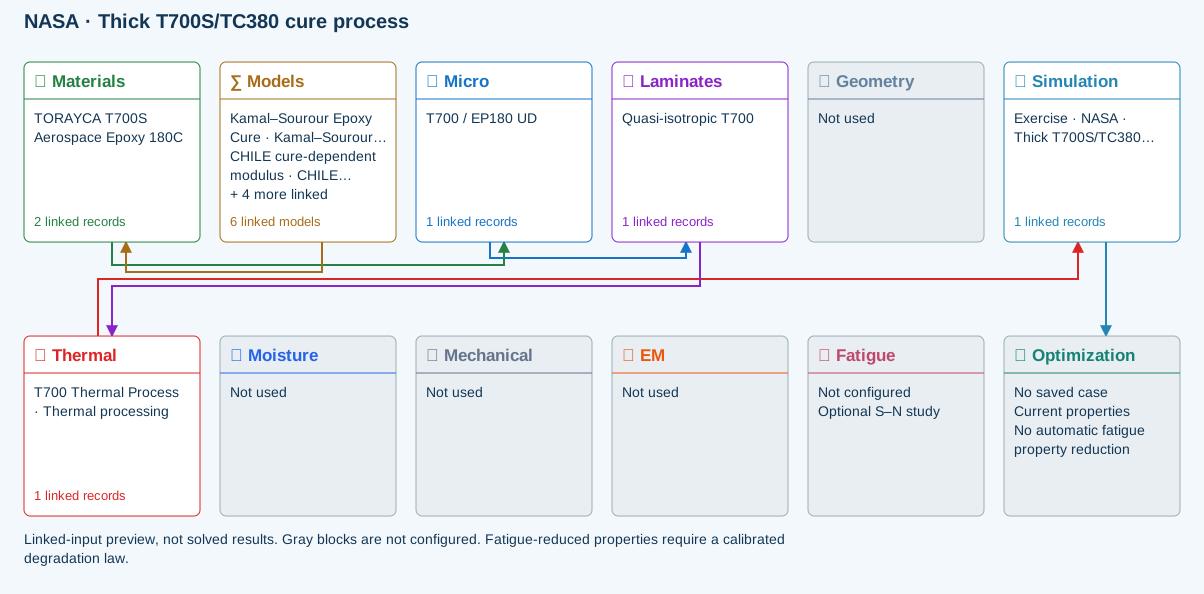
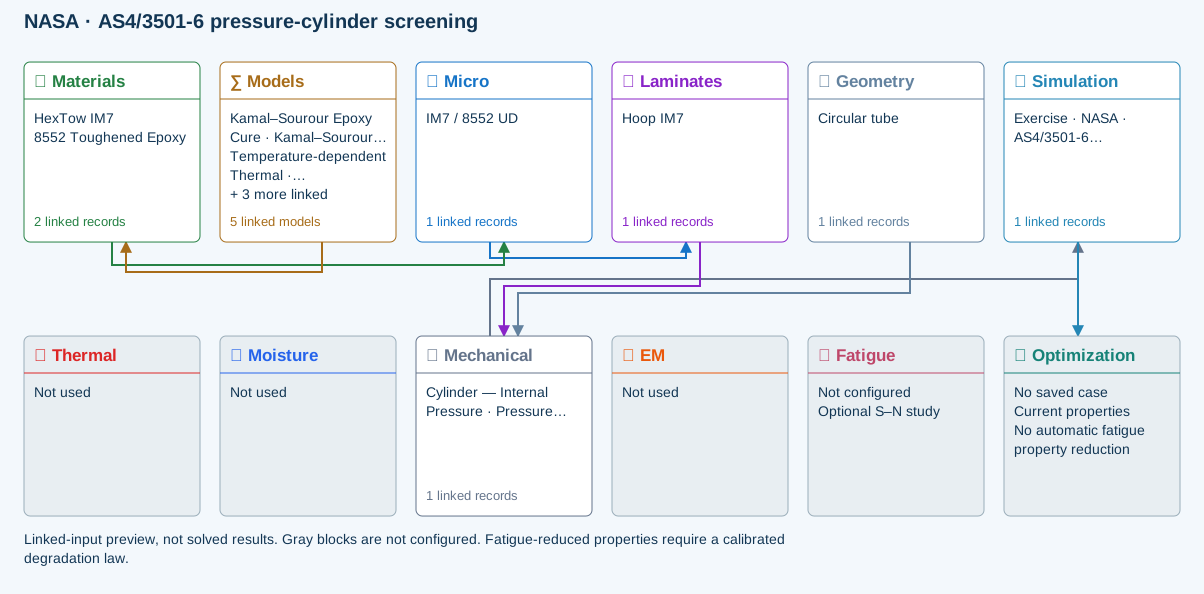
Two-row simulation workflow · Open full-size map ↗ ∑ Selected models & submodels These are the exercise’s linked choices, not solved results. Open a first-layer model to see its submodels and scope.
Kamal–Sourour autocatalytic · Kamal–Sourour Epoxy Cure Reusable material model. It contributes only when assigned to a material used by this simulation; separate model records can supply independent properties.
Calibration & applicability Illustrative model defaults — replace with characterized resin kinetics
∑ Theory & assumptions CHILE (degree of cure) · CHILE cure-dependent modulus Reusable material model. It contributes only when assigned to a material used by this simulation; separate model records can supply independent properties. Cure-dependent modulus does not automatically scale strength allowables.
Calibration & applicability CHILE(α), section 2.4 of Materials 2019, 12, 259. Example parameters, not measured EP180 data. Fixed Poisson ratio; no viscoelastic relaxation or Tg softening. Incremental elastic stress integration at saved process intervals: check time-step convergence. Strength allowables are independent measured inputs, not scaled with modulus.
∑ Theory & assumptions Temperature-dependent tabular · Temperature-dependent Thermal Reusable material model. It contributes only when assigned to a material used by this simulation; separate model records can supply independent properties. Micro uses the 23 °C reference; Process evaluates the same table at local temperature, without extrapolation.
Calibration & applicability Check source data, applicable environment and validity limits in the model record; saved defaults are not experimental validation.
∑ Theory & assumptions 1D Fickian diffusion · Layered Fickian Diffusion Reusable material model. It contributes only when assigned to a material used by this simulation; separate model records can supply independent properties.
Calibration & applicability Check source data, applicable environment and validity limits in the model record; saved defaults are not experimental validation.
∑ Theory & assumptions Halpin–Tsai · T700 / EP180 UD One compatible homogenization model per Micro recipe. Separate recipes compare models; their predictions are not blended.
∑ Theory & assumptions CLT · Linear static with failure indices · Plate — Nx Static Validation · Unidirectional lamina Shared laminate stiffness drives this membrane/CLT path. Failure criteria are independent comparisons, not blended models. Fatigue is a separate assessment.
Failure criterion · Maximum stress Primary criterion. Additional envelope comparisons are chosen in Response → Failure; they run independently.
∑ Theory & assumptions Data travelling between blocks Micro → Laminates
Materials → Micro
Models → Materials
Mechanical → Simulation
Laminates → Mechanical
Geometry → Mechanical
Simulation → Optimization
NASA · T700/PR520 lamina analysis 1. Getting started · case-lamina-analysis
Application Constituent-to-lamina comparison Models Halpin–Tsai · Rule of mixtures · MAC/GMC comparison Geometry Unidirectional lamina Setup required: The copied T700/EP180 database is a connected starter, not T700/PR520. Complete the constituent setup below before comparing with NASA.
Reference validation · 2026-09-18 Not benchmark validated
No matched quantitative reference comparison completed for the full exercise.
Recorded baseline only—not a certification of the current database, edited inputs, or every output. Analytical agreement is not experimental material or failure validation.
Source validation, comparisons and tested inputs Execution: Completed (not validation)
The copied T700/EP180 database is a connected starter, not T700/PR520. Complete the constituent setup below before comparing with NASA.
Tested inputs Input SHA-256: f332a9c41bf7dc1aaa5eb2521be80c1e6feeef085db48ea61d81a3475b42b7b9
Constituent-to-lamina screening only. The NASA braid subcells, calibrated LS-DYNA damage and coupon validation are not reproduced. Separate published-data fixture: Benchmark discrepancy Source-matched constituent fixture compared with NASA MAC/GMC, 1% exploratory equivalence criterion declared before running. A different homogenization model need not match; mismatch is retained, not fitted away.
Acceptance: absolute error ≤ absolute tolerance + relative tolerance × |reference|. Quantity CDS Reference Error % Tolerance (relative + absolute) Result E1 at Vf=0.375 (GPa) 88.75 88.5 0.2824859 1% + 0.00002 GPa Pass E2 at Vf=0.375 (GPa) 5.51724 6.22 -11.29839 1% + 0.00002 GPa Discrepancy G12 at Vf=0.375 (GPa) 2.23256 2.6 -14.13231 1% + 0.00002 GPa Discrepancy E1 at Vf=0.733 (GPa) 169.658 169.5 0.09321534 1% + 0.00002 GPa Pass E2 at Vf=0.733 (GPa) 8.64927 9.9 -12.63364 1% + 0.00002 GPa Discrepancy G12 at Vf=0.733 (GPa) 4.70445 7 -32.79357 1% + 0.00002 GPa Discrepancy E1 at Vf=0.8 (GPa) 184.8 184.7 0.05414185 1% + 0.00002 GPa Pass E2 at Vf=0.8 (GPa) 9.67742 10.9 -11.21633 1% + 0.00002 GPa Discrepancy G12 at Vf=0.8 (GPa) 5.93407 6 -1.098833 1% + 0.00002 GPa Discrepancy
Fixture inputs {
"fiber": {
"E1": 230,
"E2": 15,
"G12": 27,
"nu12": 0.2
},
"matrix": {
"E": 4,
"G": 1.44,
"nu": 0.38
},
"volumeFractions": [
0.375,
0.733,
0.8
],
"voidFraction": 0,
"model": "Rule of mixtures"
} Separate published-data fixture: Benchmark discrepancy Source-matched constituent fixture compared with NASA MAC/GMC, 1% exploratory equivalence criterion declared before running. A different homogenization model need not match; mismatch is retained, not fitted away.
Acceptance: absolute error ≤ absolute tolerance + relative tolerance × |reference|. Quantity CDS Reference Error % Tolerance (relative + absolute) Result E1 at Vf=0.375 (GPa) 88.75 88.5 0.2824859 1% + 0.00002 GPa Pass E2 at Vf=0.375 (GPa) 6.62252 6.22 6.471383 1% + 0.00002 GPa Discrepancy G12 at Vf=0.375 (GPa) 2.90406 2.6 11.69462 1% + 0.00002 GPa Discrepancy E1 at Vf=0.733 (GPa) 169.658 169.5 0.09321534 1% + 0.00002 GPa Pass E2 at Vf=0.733 (GPa) 10.47761 9.9 5.834444 1% + 0.00002 GPa Discrepancy G12 at Vf=0.733 (GPa) 7.00011 7 0.001571429 1% + 0.00002 GPa Pass E1 at Vf=0.8 (GPa) 184.8 184.7 0.05414185 1% + 0.00002 GPa Pass E2 at Vf=0.8 (GPa) 11.43662 10.9 4.923119 1% + 0.00002 GPa Discrepancy G12 at Vf=0.8 (GPa) 8.80865 6 46.81083 1% + 0.00002 GPa Discrepancy
Fixture inputs {
"fiber": {
"E1": 230,
"E2": 15,
"G12": 27,
"nu12": 0.2
},
"matrix": {
"E": 4,
"G": 1.44,
"nu": 0.38
},
"volumeFractions": [
0.375,
0.733,
0.8
],
"voidFraction": 0,
"model": "Halpin–Tsai model"
} Download source-validation evidence (JSON) · Full 104-exercise study
Prepare the study Open this exercise in Workbench. Confirm the selected simulation and follow the workflow arrows to its linked records. Review the setup note, units, material sources and model limits below. Preserve shared reference records: duplicate a record before making an independent variation. Check the connected input summary and any validation notices before running. A preview diagram is not a solved result. Complete the exercise Open the linked web walkthrough and NASA/TM–2015-218814. Rename the copied constituents for this study; enter T700 E1/E2/G12 = 230/15/27 GPa, ν12 = 0.20 and density 1.80 g/cm³. Enter PR520 E/ν/G = 4.0 GPa/0.38/1.44 GPa and density 1.25 g/cm³. Preserve the research citation; do not substitute the starter resin properties. Use continuous unidirectional micromechanics with zero voids. Evaluate Vf = 0.375, 0.733 and 0.800, holding every other input fixed. Save three copies or an optimization comparison. Compare E1/E2/G12 against 88.5/6.22/2.60, 169.5/9.90/7.00 and 184.7/10.9/6.00 GPa respectively. Report 100 × (CDS − reference) / reference; compare another supported homogenization model. Save the chosen predicted lamina and source links. Leave unsupported strength and transport data unavailable; do not carry over unrelated starter allowables. Review checkpoints Published MAC/GMC values are external comparison data, not exact acceptance targets for Halpin–Tsai. Keep the three local fiber-volume regions separate; averaging braid subcells needs justification. Record your conclusion Save the study with its inputs and capture the relevant output plot or table, units, solver notices and the comparison requested above. State whether each checkpoint was met and explain discrepancies. Claim benchmark validation only where the source-validation panel explicitly supports it.
User Guide · operating the Workbench → · ∑ Theory Manual · equations and assumptions →
Model limits Constituent-to-lamina screening only. The NASA braid subcells, calibrated LS-DYNA damage and coupon validation are not reproduced.
Reference material How the shared curriculum works Read the reference Select an exercise from the shared CDS database Trace inputs in Simulation Run and inspect fields Compare checkpoints and record limits SIMULATION selects the Thermal, Moisture, Mechanical and EM cases to run, with None available in each slot. Geometry owns shared specimen dimensions; Laminate owns plies and thickness. Each case owns one analysis model, its applied conditions and its applicable cycle; there is no separate Process block. Surrounding blocks manage available records. Run updates results; completed does not mean validated or passed.
All 104 exercises select connected records from one shared default database. Opening an exercise does not add duplicate materials. Changes to shared records affect studies using them; duplicate a record for an independent variation. Downloads provide self-contained subsets of that database and require sign-in and an active CDS license. Exercise links open the matching guide; they do not run a solver or replace your database. Historical files remain in a separate portal archive.
Catalogue revision 2026-09-09. Source-data case studies require the setup and calibration described in their guides.
Explore this section
4 destinations