
04.12.1 / CDS Training Manual
Predict T700/PR520
effective lamina properties.
A bottom-up micromechanics study using constituent values and three fiber-volume regions published for a NASA triaxial-braid model.
Complete manuals · download a whole collection
Each collection includes an editable Word manual and its matching searchable PDF, with linked contents, explanatory text, diagrams and references. Theory equations use native Word mathematics. Individual-page PDF buttons remain available.
These are dated reading editions of the public learning content. Interactive studies and account-controlled classroom notes and databases stay online. For current changes, follow the chapter links back to the website.
Current Workbench, reference editions and downloads
Use the online User Guide for current controls, the released model directory for selectable models and compatibility, and the Training Manual for connected exercises. Wider theory references do not mean every formulation is enabled in Workbench.
Dated GUI captures and compiled Web r18 PDF manuals retain their stated scope; they are not a substitute for current hosted Workbench instructions. Find the overview PDF, guides and exercise databases in Your CDS library.
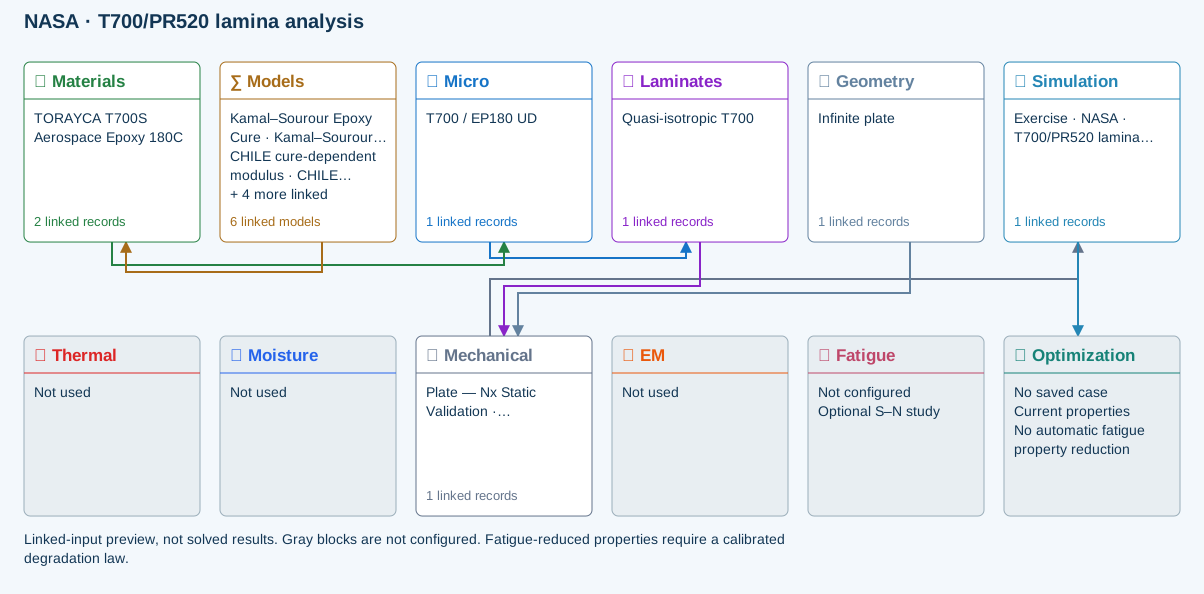
Linked-input preview, not solved results. Gray blocks are not configured.
∑ Selected models & submodels
These are the exercise’s linked choices, not solved results. Open a first-layer model to see its submodels and scope.
Kamal–Sourour autocatalytic · Kamal–Sourour Epoxy Cure
Reusable material model. It contributes only when assigned to a material used by this simulation; separate model records can supply independent properties.
Calibration & applicability
Illustrative model defaults — replace with characterized resin kinetics
CHILE (degree of cure) · CHILE cure-dependent modulus
Reusable material model. It contributes only when assigned to a material used by this simulation; separate model records can supply independent properties. Cure-dependent modulus does not automatically scale strength allowables.
Calibration & applicability
CHILE(α), section 2.4 of Materials 2019, 12, 259. Example parameters, not measured EP180 data. Fixed Poisson ratio; no viscoelastic relaxation or Tg softening. Incremental elastic stress integration at saved process intervals: check time-step convergence. Strength allowables are independent measured inputs, not scaled with modulus.
Temperature-dependent tabular · Temperature-dependent Thermal
Reusable material model. It contributes only when assigned to a material used by this simulation; separate model records can supply independent properties. Micro uses the 23 °C reference; Process evaluates the same table at local temperature, without extrapolation.
Calibration & applicability
Check source data, applicable environment and validity limits in the model record; saved defaults are not experimental validation.
1D Fickian diffusion · Layered Fickian Diffusion
Reusable material model. It contributes only when assigned to a material used by this simulation; separate model records can supply independent properties.
Calibration & applicability
Check source data, applicable environment and validity limits in the model record; saved defaults are not experimental validation.
Halpin–Tsai · T700 / EP180 UD
One compatible homogenization model per Micro recipe. Separate recipes compare models; their predictions are not blended.
∑ Theory & assumptionsCLT · Linear static with failure indices · Plate — Nx Static Validation · Unidirectional lamina
Shared laminate stiffness drives this membrane/CLT path. Failure criteria are independent comparisons, not blended models. Fatigue is a separate assessment.
Failure criterion · Maximum stress
Primary criterion. Additional envelope comparisons are chosen in Response → Failure; they run independently.
Data travelling between blocks
Micro → Laminates
Predicted ply stiffness, strength, density and expansion properties.
Materials → Micro
Constituent stiffness, strength, density and thermal / moisture properties.
Models → Materials
Model choices and calibrated parameters.
Mechanical → Simulation
SIMULATION selects this case and its analysis model; the case owns its applicable cycle and input references.
Laminates → Mechanical
Ply angles and thicknesses, stiffness, mass and ply properties.
Geometry → Mechanical
Shape and dimensions for the selected structural analysis.
Simulation → Optimization
Linked inputs and current-property response for candidate evaluation.
Reference validation · 2026-09-18
Not benchmark validated
No matched quantitative reference comparison completed for the full exercise.
Recorded baseline only—not a certification of the current database, edited inputs, or every output. Analytical agreement is not experimental material or failure validation.
Source validation, comparisons and tested inputs
Execution: Completed (not validation)
The copied T700/EP180 database is a connected starter, not T700/PR520. Complete the constituent setup below before comparing with NASA.
- NASA/TM—2015-218814 — Experimental and Numerical Analysis of Triaxially Braided Composites Utilizing a Modified Subcell Modeling Approach ↗Tables 3–4, printed page 7 / PDF page 11. MAC/GMC calculated effective ply data, not measured UD coupon properties.
Tested inputs
Input SHA-256: f332a9c41bf7dc1aaa5eb2521be80c1e6feeef085db48ea61d81a3475b42b7b9
Solver source SHA-256: 30c8a614b6cb004a26da8adaf8ab7c534c37c4d534836921939f35a549e1bcc5
- Constituent-to-lamina screening only. The NASA braid subcells, calibrated LS-DYNA damage and coupon validation are not reproduced.
Separate published-data fixture: Benchmark discrepancy
Source-matched constituent fixture compared with NASA MAC/GMC, 1% exploratory equivalence criterion declared before running. A different homogenization model need not match; mismatch is retained, not fitted away.
| Quantity | CDS | Reference | Error % | Tolerance (relative + absolute) | Result |
|---|---|---|---|---|---|
| E1 at Vf=0.375 (GPa) | 88.75 | 88.5 | 0.2824859 | 1% + 0.00002 GPa | Pass |
| E2 at Vf=0.375 (GPa) | 5.51724 | 6.22 | -11.29839 | 1% + 0.00002 GPa | Discrepancy |
| G12 at Vf=0.375 (GPa) | 2.23256 | 2.6 | -14.13231 | 1% + 0.00002 GPa | Discrepancy |
| E1 at Vf=0.733 (GPa) | 169.658 | 169.5 | 0.09321534 | 1% + 0.00002 GPa | Pass |
| E2 at Vf=0.733 (GPa) | 8.64927 | 9.9 | -12.63364 | 1% + 0.00002 GPa | Discrepancy |
| G12 at Vf=0.733 (GPa) | 4.70445 | 7 | -32.79357 | 1% + 0.00002 GPa | Discrepancy |
| E1 at Vf=0.8 (GPa) | 184.8 | 184.7 | 0.05414185 | 1% + 0.00002 GPa | Pass |
| E2 at Vf=0.8 (GPa) | 9.67742 | 10.9 | -11.21633 | 1% + 0.00002 GPa | Discrepancy |
| G12 at Vf=0.8 (GPa) | 5.93407 | 6 | -1.098833 | 1% + 0.00002 GPa | Discrepancy |
- NASA/TM—2015-218814 — Experimental and Numerical Analysis of Triaxially Braided Composites Utilizing a Modified Subcell Modeling Approach ↗Tables 3–4, printed page 7 / PDF page 11. MAC/GMC calculated effective ply data, not measured UD coupon properties.
Fixture inputs
{
  "fiber": {
    "E1": 230,
    "E2": 15,
    "G12": 27,
    "nu12": 0.2
  },
  "matrix": {
    "E": 4,
    "G": 1.44,
    "nu": 0.38
  },
  "volumeFractions": [
    0.375,
    0.733,
    0.8
  ],
  "voidFraction": 0,
  "model": "Rule of mixtures"
}
Separate published-data fixture: Benchmark discrepancy
Source-matched constituent fixture compared with NASA MAC/GMC, 1% exploratory equivalence criterion declared before running. A different homogenization model need not match; mismatch is retained, not fitted away.
| Quantity | CDS | Reference | Error % | Tolerance (relative + absolute) | Result |
|---|---|---|---|---|---|
| E1 at Vf=0.375 (GPa) | 88.75 | 88.5 | 0.2824859 | 1% + 0.00002 GPa | Pass |
| E2 at Vf=0.375 (GPa) | 6.62252 | 6.22 | 6.471383 | 1% + 0.00002 GPa | Discrepancy |
| G12 at Vf=0.375 (GPa) | 2.90406 | 2.6 | 11.69462 | 1% + 0.00002 GPa | Discrepancy |
| E1 at Vf=0.733 (GPa) | 169.658 | 169.5 | 0.09321534 | 1% + 0.00002 GPa | Pass |
| E2 at Vf=0.733 (GPa) | 10.47761 | 9.9 | 5.834444 | 1% + 0.00002 GPa | Discrepancy |
| G12 at Vf=0.733 (GPa) | 7.00011 | 7 | 0.001571429 | 1% + 0.00002 GPa | Pass |
| E1 at Vf=0.8 (GPa) | 184.8 | 184.7 | 0.05414185 | 1% + 0.00002 GPa | Pass |
| E2 at Vf=0.8 (GPa) | 11.43662 | 10.9 | 4.923119 | 1% + 0.00002 GPa | Discrepancy |
| G12 at Vf=0.8 (GPa) | 8.80865 | 6 | 46.81083 | 1% + 0.00002 GPa | Discrepancy |
- NASA/TM—2015-218814 — Experimental and Numerical Analysis of Triaxially Braided Composites Utilizing a Modified Subcell Modeling Approach ↗Tables 3–4, printed page 7 / PDF page 11. MAC/GMC calculated effective ply data, not measured UD coupon properties.
Fixture inputs
{
  "fiber": {
    "E1": 230,
    "E2": 15,
    "G12": 27,
    "nu12": 0.2
  },
  "matrix": {
    "E": 4,
    "G": 1.44,
    "nu": 0.38
  },
  "volumeFractions": [
    0.375,
    0.733,
    0.8
  ],
  "voidFraction": 0,
  "model": "Halpin–Tsai model"
}
Download source-validation evidence (JSON) · Full 104-exercise study
Predict how T700/PR520 effective ply stiffness changes across the three local fiber-volume regions used in NASA’s absorbed-matrix braid model.
CDS reproduces a constituent-to-lamina comparison. It does not reproduce the report’s complete braid subcell, LS-DYNA damage calibration, or coupon validation.
Published basis
1 primary sourceStarting data
Enter in the displayed units| Variable | Value | How it is used |
|---|---|---|
| T700 density | 1.80 g/cm³ | Fiber physical property |
| T700 E1 / E2 | 230 / 15 GPa | Fiber axial and transverse modulus |
| T700 ν12 / G12 | 0.20 / 27 GPa | Fiber coupling and shear |
| PR520 density | 1.25 g/cm³ | Matrix physical property |
| PR520 E / ν / G | 4.0 GPa / 0.38 / 1.44 GPa | Isotropic matrix elasticity |
| Fiber volume fractions | 37.5%, 73.3%, 80.0% | Three separate micromechanics evaluations |
Review checkpoints
Comparison, not certification| Result | Published reference | Interpretation |
|---|---|---|
| Vf 37.5%: E1 / E2 / G12 | 88.5 / 6.22 / 2.60 GPa | B-braider effective ply |
| Vf 73.3%: E1 / E2 / G12 | 169.5 / 9.90 / 7.00 GPa | A/C-braider effective ply |
| Vf 80.0%: E1 / E2 / G12 | 184.7 / 10.9 / 6.00 GPa | A-axial effective ply |
All exercises, case studies and simulation examples → · Your CDS library: overview, manuals and database downloads →
Create traceable constituent records
Duplicate the nearest carbon-fiber and thermoset records so the library baselines remain unchanged.
- Name the records T700 — NASA case study and PR520 — NASA case study.
- Enter the density and elastic values from the starting-data table. For the isotropic matrix, use E = 4.0 GPa, ν = 0.38 and G = 1.44 GPa.
- Add the NASA report as the source, mark the values as published research inputs, and leave unsupported strength or transport terms visibly incomplete.
Link a continuous-fiber micromechanics model
Create or duplicate a unidirectional micromechanics record and link the T700 fiber and PR520 matrix.
- Choose a model that reports the full orthotropic lamina stiffness.
- Set void fraction to zero for the baseline comparison and keep empirical closure parameters at their documented defaults.
- Confirm Live Microstructure and the dependency summary point to the two case-study constituent records.
Sweep the three published fiber fractions
Use Lamina / Micro optimization or three duplicated model records to evaluate Vf = 37.5%, 73.3% and 80.0%.
- Hold all other inputs fixed and evaluate each volume fraction.
- Plot Vf against E1, E2 and G12; use a line view for the trend and the table for exact values.
- Save one optimization snapshot or export one comparison table containing all three cases.
Compare the effective lamina response
Compare CDS output with NASA’s MAC/GMC values in the checkpoint table. Expect the longitudinal trend to be strongest and model-dependent differences in transverse and shear response.
- Calculate percent difference as 100 × (CDS − reference) / reference for each modulus.
- Inspect the selected model’s assumptions before attributing differences to input data.
- Repeat with another supported homogenization model to show model-form sensitivity.
Save the predicted lamina for downstream work
Create a new lamina material from the selected prediction and retain the model and source links.
- Choose the fiber fraction appropriate to the intended region rather than averaging the three NASA subcells without justification.
- Save the generated material with Prediction status.
- Open the new record and verify that its provenance identifies both constituents and the micromechanics model.
Workbench availability: released models, inputs and compatible study paths. The wider theory library includes reference formulations not available in every Workbench solve.