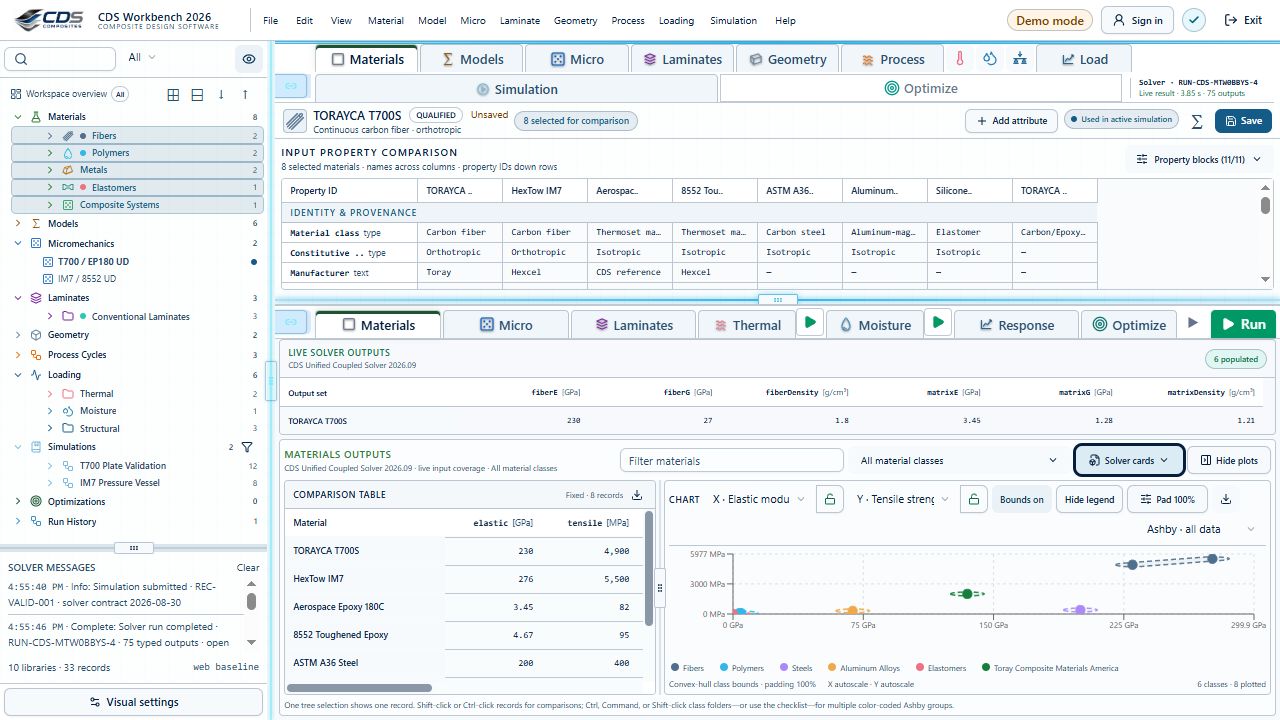
Compare properties
Select one or more materials, laminas, laminates, simulations or optimization snapshots and review scrollable tables, bar charts, Ashby plots, line plots, property maps, and laminate stiffness matrices.
Capabilities / 02.7
A result is more useful when you can see why it changed. Compare records, inspect fields and tables, and use parametric studies to follow the drivers. Export the data you need for the next engineering step.
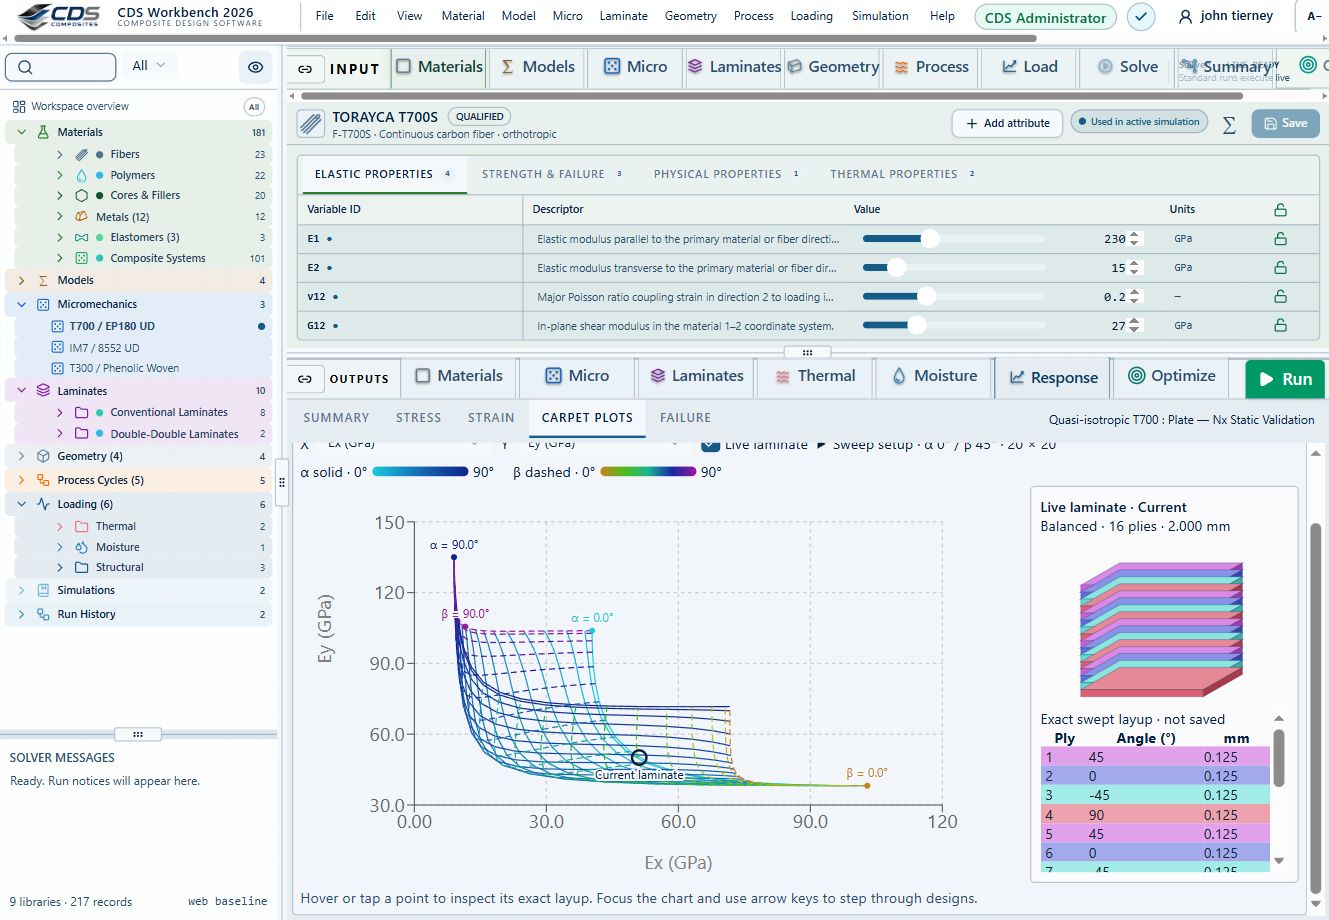
A linked carpet plot and laminate stack make the selected design visible alongside its properties.
Workbench capture · September 6, 2026. This capture shows the interface with demo data. It is not a new solver run or a validation certificate. Control locations may differ in later releases.Connected study preview, not a live calculation. Edit inputs and inspect results in Workbench.
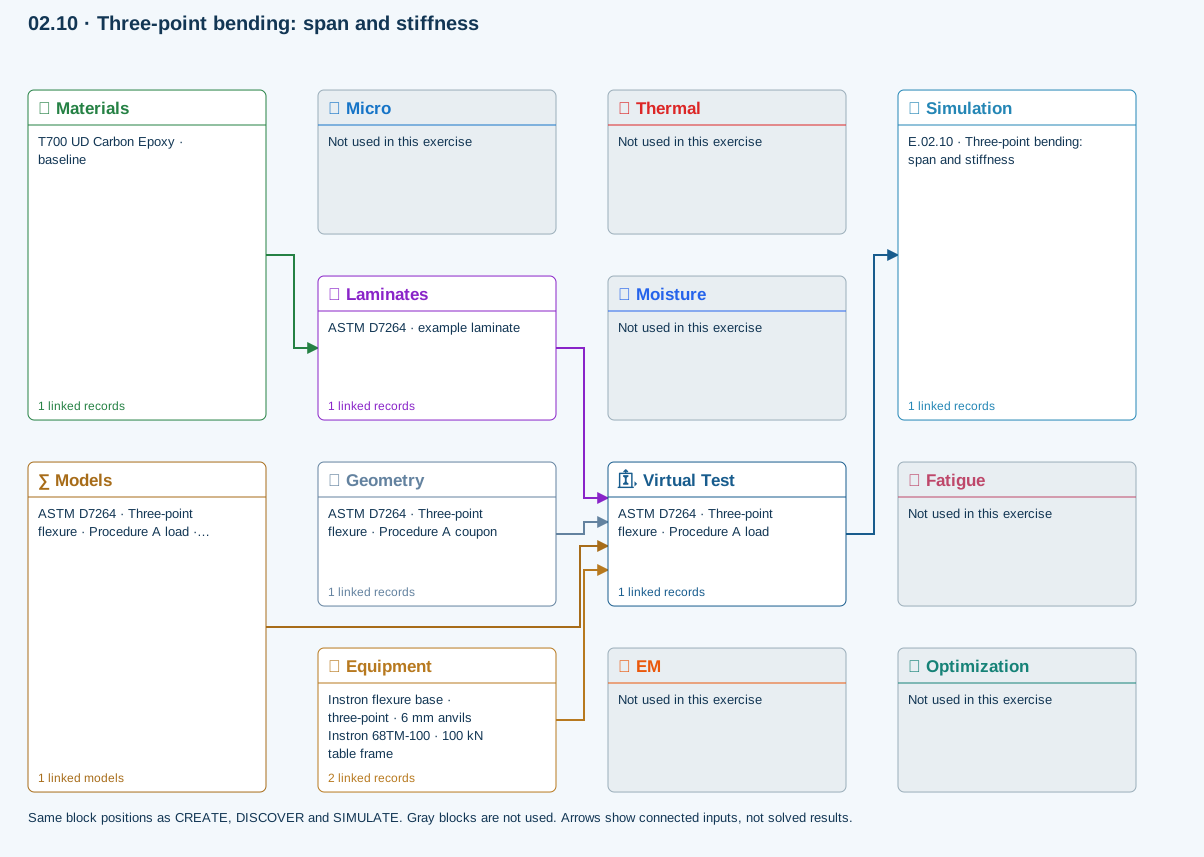
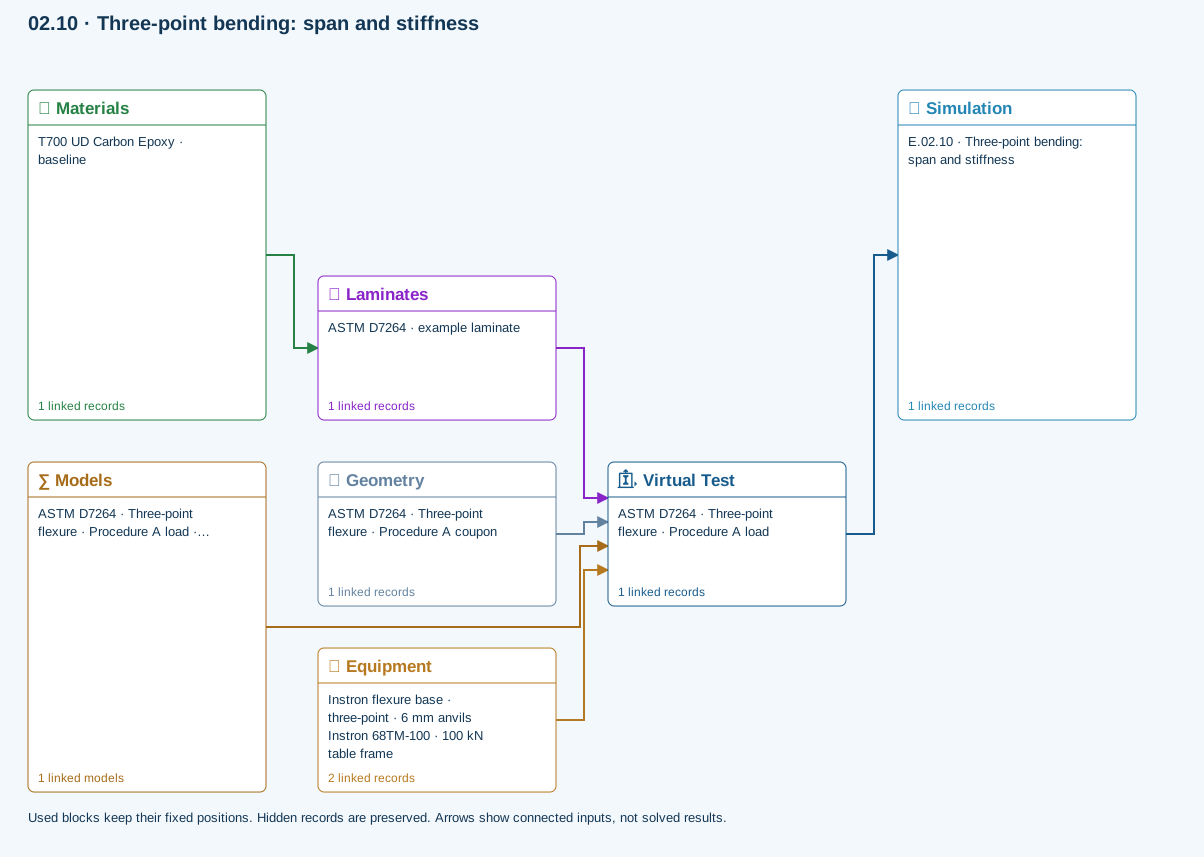
All blocks keep the CREATE / DISCOVER / SIMULATE positions, with Equipment below Geometry; unused records remain disconnected. This changes the view only, not the exercise records. The diagram shows the setup, not solved results.
Only models assigned to records used by this exercise are listed here. The full-layout option preserves the supplied starter records; no Workbench records are changed.
Beam bending uses effective laminate axial stiffness, the linked section geometry, support span and applied loading. Euler–Bernoulli deflection excludes transverse shear deformation, roller contact and indentation. Ply stress recovery for rectangular laminate coupons is separate from section-level beam stress recovery.
∑ Theory & assumptionsMaterials → Laminates
Stored ply stiffness, strength, density and expansion properties.
Virtual Test → Simulation
SIMULATION selects this case and its analysis model; the case owns its applicable cycle and input references.
Laminates → Virtual Test
Ply angles and thicknesses, stiffness, mass and ply properties.
Geometry → Virtual Test
Part shape and dimensions, thickness or section definition, and model-specific geometric inputs. Each selected case consumes only the dimensions its model supports.
Equipment → Virtual Test
Linked testing machine and fixture: load capacities, fixture type, specimen-fit and support-span limits, and mounted setup dimensions. The selected test case supplies the applied loading; hardware limits are checked against its setup.
Models → Virtual Test
Applied model assignment: Euler–Bernoulli beam · Linear static. Model parameters and formulation are used by Virtual Test.
Inspect specimen width, laminate thickness, support span and central force.
Models: Euler–Bernoulli beam · ASTM D7264-26-based
Procedure A teaching setup. Transverse shear deformation, roller contact and indentation are excluded.
02.7 / How to use it
What to set, compare and checkSelect one or more materials, laminas, laminates, simulations or optimization snapshots and review scrollable tables, bar charts, Ashby plots, line plots, property maps, and laminate stiffness matrices.
Move result cursors through time and thickness to update linked thermal plots, or select stress, strain, displacement, resultant, and factor-of-safety views for a structural case.
Right-click supported tables to save CSV or XLSX data and presentation-oriented PPTX output where available, or write supported material cards for downstream finite-element analysis.
Explore the models, connections and theory →
What to check and where it applies